
Writing High-Scoring Answers for Bar Chart Questions in IELTS Academic
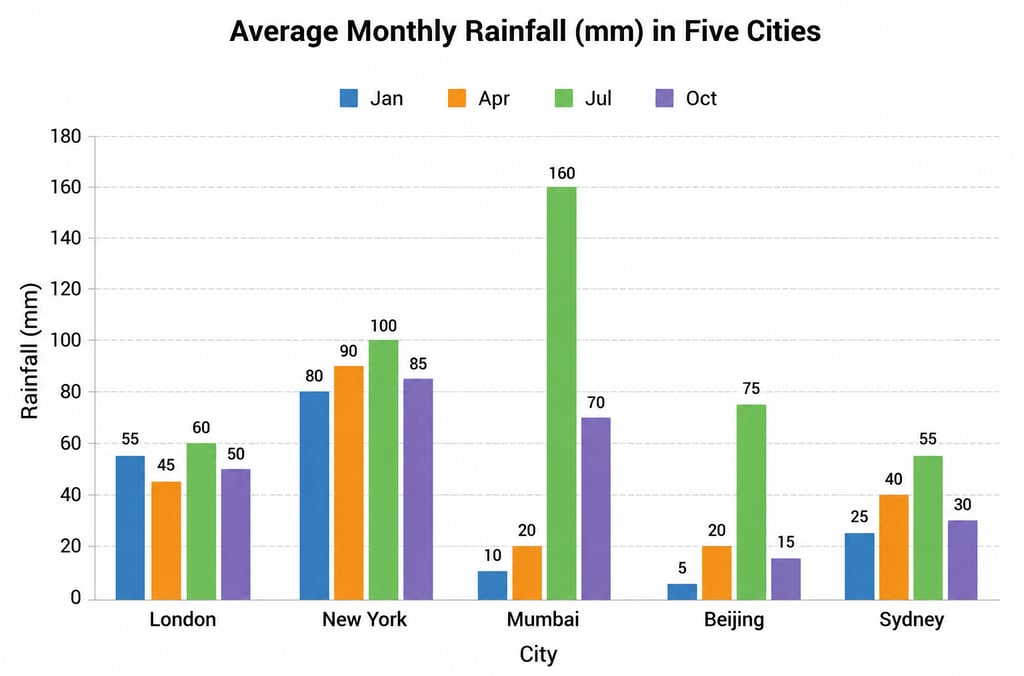
Writing high-scoring answers for IELTS Academic bar chart questions requires identifying key trends, making clear comparisons, and summarizing significant data accurately. This visual guide highlights important features such as highest and lowest figures, noticeable differences, and effective language structures to help candidates organize and present information confidently for a Band 7+ performance.
IELTS ACADEMIC - MODULE WRITING
Syed Muhammad Zargham Hameed
5/30/20268 min read
Understanding IELTS Bar Chart Questions
In the IELTS Academic exam, candidates will encounter a variety of question types, one of which involves bar charts. Bar chart questions typically present data visually through horizontal or vertical bars, allowing for a straightforward comparison of different categories or groups. Understanding this specific question format is crucial, as it tests both analytical skills and the ability to present information coherently.
The bar charts may depict various themes, such as population statistics, economic indicators, or survey results. Often, these charts aim to highlight trends over time, allowing for analysis of increases, decreases, or stability within the data set. For instance, a common theme might revolve around educational attainment across different demographics, while another could focus on consumer preferences in a given market.
Accurate interpretation of the data in bar chart questions is essential for crafting a high-scoring answer. Candidates are generally required to summarize the information, identify significant patterns, and make comparisons where relevant. This could involve discussing the heights of the bars, noting the largest and smallest values, or describing any evident correlations between the categories presented.
There are various styles and formats of bar chart questions that candidates may face. Some may include additional features, such as a legend indicating colors, while others might present grouped bar charts that compare multiple sets of data side by side. Understanding the specific components and structure of each bar chart will aid in delivering insightful analyses, thereby enhancing the candidate's performance on this section of the exam.
Key Strategies for Analyzing Bar Charts
When tasked with analyzing bar charts in IELTS Academic writing, a systematic approach is key to providing clear and effective answers. Understanding the bar chart's structure is essential. Begin by examining the axes, as they provide crucial context. The horizontal axis typically displays categories, while the vertical axis represents numerical values. Identifying the scale on the vertical axis can help assess the relative sizes of the bars, thus offering insight into trends and comparisons.
One strategy is to identify trends within the chart. Look for patterns such as increases or decreases over time, significant fluctuations in values, or any consistent relationships among the categories presented. For instance, if one bar is consistently taller than another across different points, it indicates a persistent dominance or lack thereof in data points. Recognizing these trends will aid in formulating a coherent narrative around the data.
Furthermore, comparing data points is vital for interpreting the key features of the chart. This involves not just looking at individual bars but also evaluating the relationship between them. Are some categories performing better than others? Is there a notable gap between certain values? Establishing these relationships is crucial for creating a comprehensive analysis. Moreover, using comparative language can enhance the quality of the response; phrases such as "in contrast to" or "similarly" help to draw connections effectively.
Finally, accurate labeling and understanding of the chart’s various elements should not be overlooked. Take note of legends, labels, and any additional annotations that provide context. This ensures that your analysis is not only thorough but also anchored in the specific details presented by the bar chart. By employing these strategies, candidates can excel in presenting high-scoring answers for bar chart questions in IELTS Academic writing.
Structuring Your Answer for Clarity and Coherence
When tasked with writing answers to bar chart questions in the IELTS Academic exam, it is essential to adopt a well-defined structure. A clear and logically coherent response not only aids in communicating the data effectively but also showcases the candidate's writing skills. The optimal framework for crafting high-scoring answers can be divided into three main parts: an introduction, a body that comprises detailed data comparisons, and a conclusion.
The introduction serves as a preliminary overview of the bar chart. This section should briefly mention what the chart illustrates, including the time period, the categories involved, and any notable trends or patterns. A concise introduction sets the context for the reader and prepares them for the details that will follow. For instance, you might begin your answer with a statement like, "The bar chart illustrates the percentage of students enrolled in various courses over a five-year period, showcasing shifts in popularity across different disciplines."
Moving on to the body, this is where the bulk of your analysis should lie. It is beneficial to group data into logical sections for clearer comparisons. For example, you could highlight the highest and lowest categories and then provide a comparative analysis for those in between. Utilizing comparative language such as "more than" or "less than" not only enhances clarity but also helps maintain coherence throughout your answer. It is important to describe significant trends, changes, or any anomalies in the data comprehensively without veering too far from the information presented in the bar chart.
Finally, the conclusion should succinctly summarize the key points discussed in the body. A well-written conclusion reiterates the most significant data while responding to the primary question asked. This reinforces your main findings and provides a neat closure to your analysis. When executed correctly, this structured approach to answering bar chart questions not only ensures clarity and coherence but significantly contributes to a higher score in the IELTS Academic writing section.
Vocabulary and Language Tips for Describing Bar Charts
In IELTS Academic, accurately describing data presented in bar charts is crucial for achieving a high score. A rich vocabulary not only enhances the clarity of your response but also demonstrates your proficiency in the English language. Therefore, it's essential to familiarize yourself with various terms that are useful for this purpose.
To commence, when describing bar charts, employing precise verbs can significantly convey changes. Words such as 'increased', 'decreased', 'rose', 'fell', and 'remained stable' are vital for illustrating trends. These verbs can portray alterations over time or across categories effectively. For a more varied language, consider synonyms like 'surged' and 'dipped', which add depth to your descriptions.
Additionally, adjectives play a critical role in enhancing your descriptions of the data presented. Utilizing terms such as 'significant', 'marginal', 'drastic', and 'slight' can indicate the degree of change or difference between the bars. This allows for a more nuanced interpretation of the data, which can enrich your answers significantly. For instance, one might say, "There was a significant increase in sales from 2019 to 2020," instead of simply stating the figures.
Moreover, idiomatic expressions can bring a conversational tone to your writing, making it more engaging. Phrases like 'hit a peak' or 'took a nosedive' can describe dramatic changes effectively. However, it's essential to use them sparingly to maintain an academic tone. When employed correctly, these expressions will enhance the dynamism of your writing.
In summary, incorporating a variety of verbs, adjectives, and idiomatic expressions can greatly improve your ability to describe bar charts. This not only aids in presenting data accurately but also in capturing the examiner's attention, thereby contributing positively to your overall score in the IELTS Academic writing section.
Common Mistakes to Avoid in Bar Chart Responses
When tasked with writing responses to bar chart questions in the IELTS Academic exam, candidates often encounter several common pitfalls that can hinder their performance. A thorough understanding of these mistakes is crucial for formulating high-scoring answers.
One frequent error is misinterpreting the data presented in the bar chart. Candidates may misread the scales or overlook key details that affect the overview of trends. For instance, failing to notice differences in the units of measurement or the specific categories represented in the graph can lead to inaccurate descriptions. Therefore, it is essential for candidates to take a moment to examine the data carefully before formulating their responses.
Another common mistake is the failure to summarize trends accurately. Candidates often describe individual data points rather than focusing on overarching patterns. While mentioning specific figures can provide context, responses should primarily emphasize the most significant trends that the bar chart illustrates. This could include increases, decreases, or any notable distinctions between different categories. Candidates should aim to present a cohesive narrative rather than simply recounting numbers.
The neglect of comparative language is also a notable error in bar chart responses. Using comparative terms, such as "higher than" or "significantly lower than," is vital for conveying relationships between different sets of data. Without employing such language, candidates may render their analyses vague, making it difficult for examiners to grasp the full scope of the information being discussed.
To avoid these mistakes, candidates should prioritize a careful reading of the chart, hone their ability to summarize data trends effectively, and practice incorporating comparative language into their responses. By addressing these common pitfalls, candidates can significantly enhance the quality of their bar chart answers and, in turn, their overall scores in the IELTS Academic exam.
Practice Exercises for Bar Chart Questions
To excel in tackling bar chart questions in IELTS Academic, consistent practice is essential. This section outlines various practice exercises designed to help learners sharpen their analytical and writing skills for this specific task. Each exercise includes sample questions mirroring the format of IELTS exam questions, along with model answers that demonstrate high-scoring techniques.
Exercise 1: The following bar chart illustrates the number of visitors to different museums in a city over a year. Write a descriptive report summarizing the key trends and comparisons evident in the chart. Focus on specific data points, such as the busiest month and the least visited, to support your observations.
Model Answer: The bar chart indicates that the city’s museums experienced fluctuating visitor numbers throughout the year, peaking at 8,000 in July and dropping to 1,200 in February. Notably, the history museum saw a steady increase in visitors, while the art museum struggled to attract a larger audience.
Exercise 2: Analyze the bar chart detailing the sales of various electronic devices over a five-year period. Your task is to report the overall sales trends, identifying which device had the highest sales and any noteworthy changes throughout the years.
Model Answer: An examination of the bar chart reveals that tablet sales surged dramatically from 2018 to 2020, reaching 15,000 units. Conversely, smartphone sales peaked in 2019 but showed a gradual decline post that period. The data emphasizes the shifting consumer preferences towards tablets.
To maximize the effectiveness of these exercises, ensure that your responses maintain coherence and clarity. Pay attention to the structure of your report, utilizing paragraphs effectively to separate different points. Each answer should highlight significant trends and comparisons drawn from the data presented in the bar chart. Regular practice with these exercises will aid in developing a polished technique that aligns with scoring criteria used in the IELTS assessments.
Reviewing and Improving Your Writing Skills
To excel in writing high-scoring answers for bar chart questions in the IELTS Academic exam, it is essential to continuously review and refine your writing skills. Self-assessment is a vital step in this process, enabling you to identify areas needing improvement and track your progress. Start by analyzing your previous responses: look for patterns in the mistakes you commonly make, such as grammatical errors, poor structure, or unclear data interpretation.
One effective approach to enhance your writing is to utilize model answers. These examples showcase the language, structure, and style expected in high-scoring responses. By studying these models, you can gain insights into how to effectively describe trends, compare data, and draw conclusions. Additionally, online platforms and IELTS preparation websites often offer practice questions accompanied by sample responses, enabling you to practice articulating your analysis.
Another strategy involves seeking feedback. Sharing your writing with peers, mentors, or instructors can provide invaluable insights into your writing capabilities. Constructive criticism helps in recognizing blind spots in your work that you might overlook. Consider engaging in writing workshops, online forums, or study groups where sharing and reviewing responses can lead to collective growth.
Moreover, setting specific writing goals can focus your efforts and enhance your results. For instance, aim to work on a particular aspect of your writing, such as coherence or vocabulary diversity, for a set period. Tracking your improvement over time will not only boost your confidence but also sharpen your overall writing proficiency.
In conclusion, reviewing and improving your writing skills is a continual process that involves self-assessment, utilizing recommended resources, and seeking peer feedback. By implementing these strategies, you can significantly enhance your ability to craft well-structured, engaging responses to bar chart questions, thereby increasing your chances of achieving a higher score in the IELTS Academic writing section.